6.48 mm diameter nozzle delivering 0.91 l/s to the runner which is rotating at 1084 rpm and generating 225 watts into the grid at an overall efficiency of 47%.

Sunday 9 December 2018

The benefit of offset (aka: self consumption)

In the UK, people who generate electricity can be paid for what they generate. The scheme is called the Feed-in-Tariff scheme (FiTs), - and next year it comes to an end.  The end is on March 31st 2019.

It comes to an end only for new schemes. Schemes already accredited, like mine, will continue to receive payments for the duration of the original contract, - 20 years.

Feed-in-Tariff payment is made up of two parts: a payment for the total energy generated and a payment for the energy exported to the grid.  Payment for both components ends.

This change in government policy forces a re-think for those considering a renewable energy scheme: does it still make financial sense? The thrust of this blog post is to suggest that if the renewable scheme is very small hydro then there is still a strong case for going ahead.

The case rests on the idea of offset, by which is meant the expenditure saved when electricity is not purchased because you are generating it yourself. Some people call this 'self consumption'. There are two aspects to commend the proposition:

First, in years to come, the cost of electricity purchased from the grid will go up. If you generate it yourself, so the value of what you save will increase over time. Since the design life of a hydro is upward of 40 years, these savings will have many years to play out.

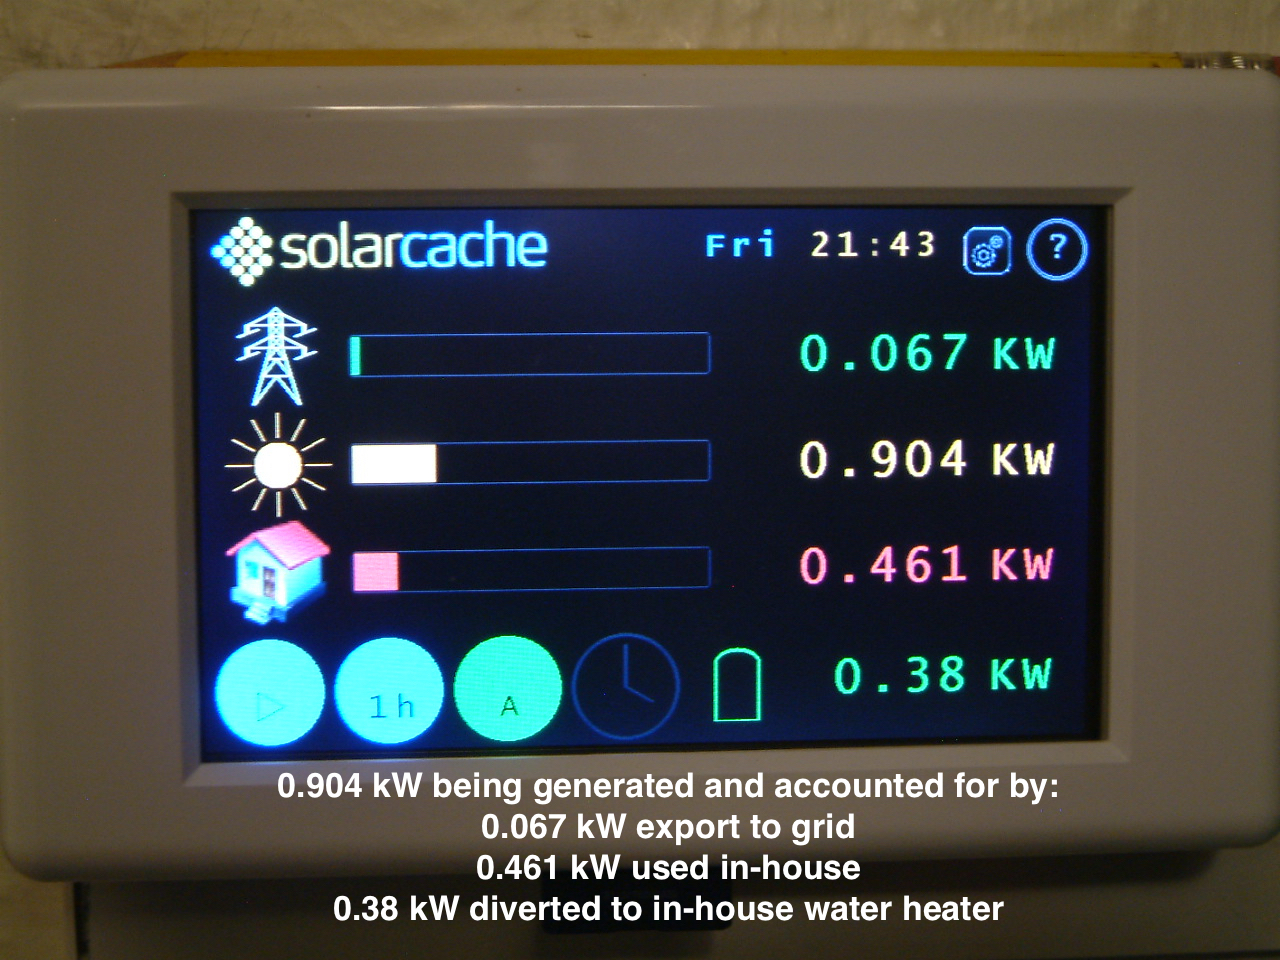
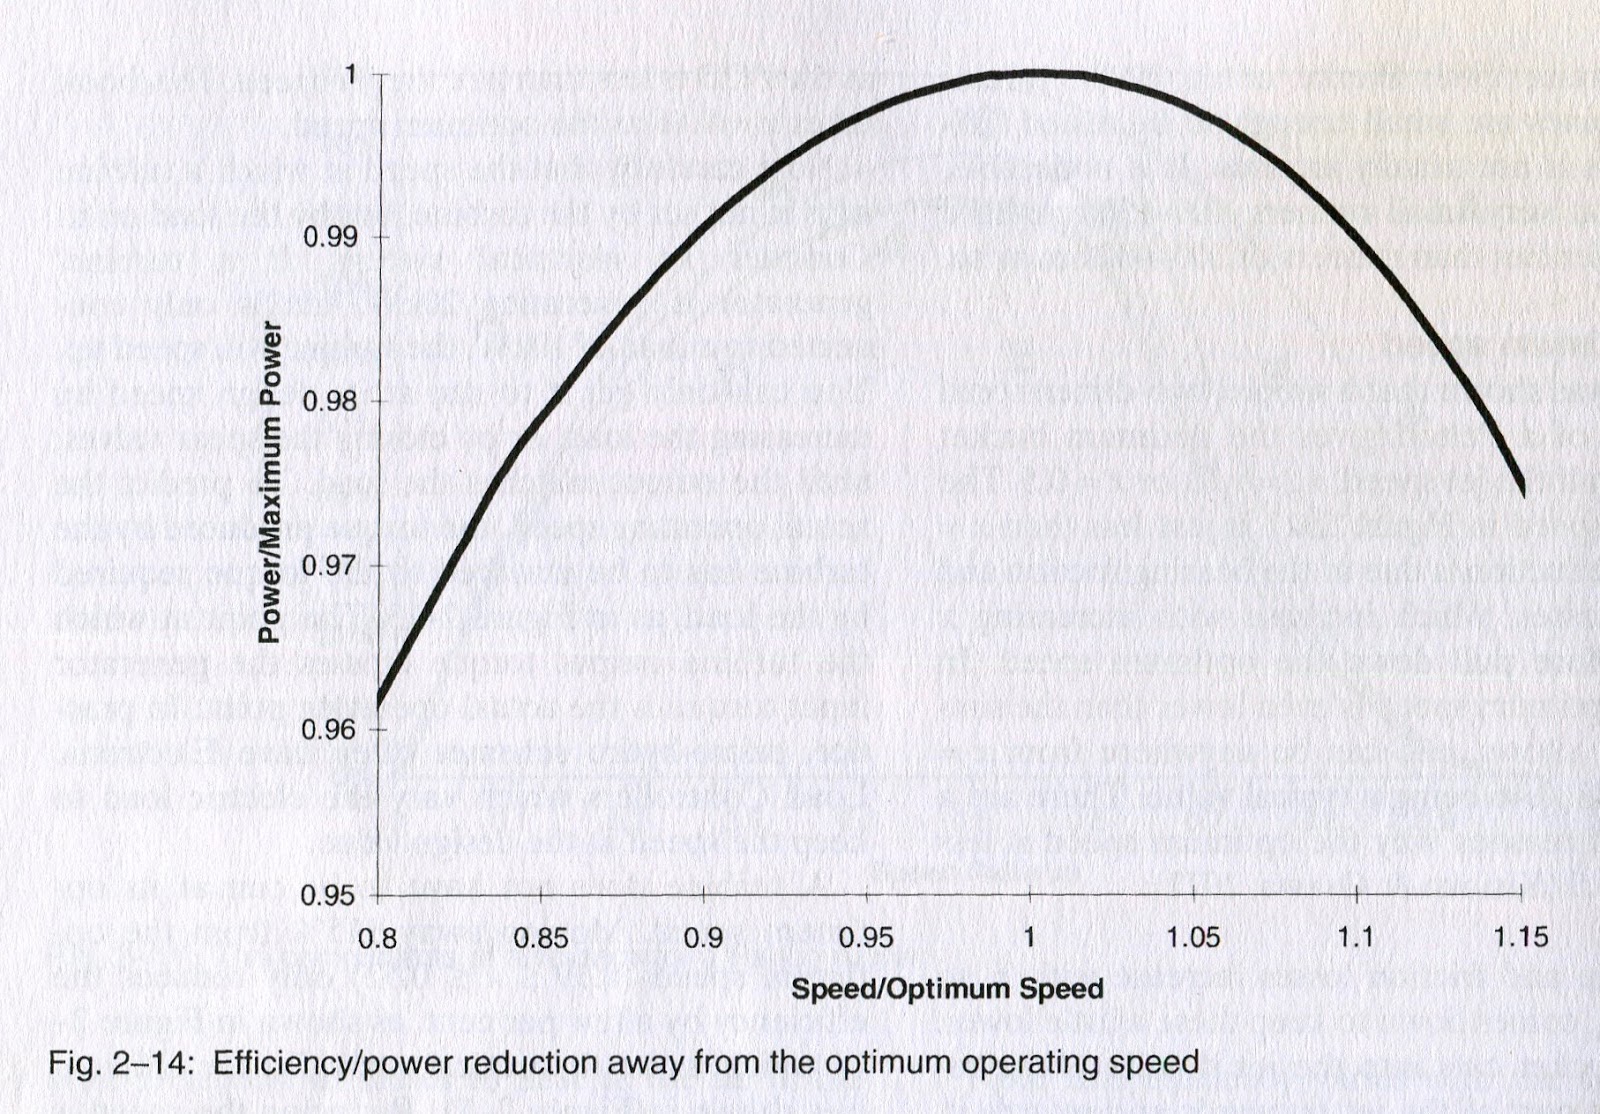
Second, there is a benefit unique to very small hydros operating 24/7. Putting out power at the relatively low level of 500 watts (+/- 300), the turbine's output closely matches the base load demand of a property.  Base load is made up of that multitude of appliances which are 'on' all the time - from battery re-chargers to fridges, freezers, central heating pumps, computers and so on. Totted up their power requirement can typically be 400 watts. That translates over a day to an energy consumption of 10 kWh.

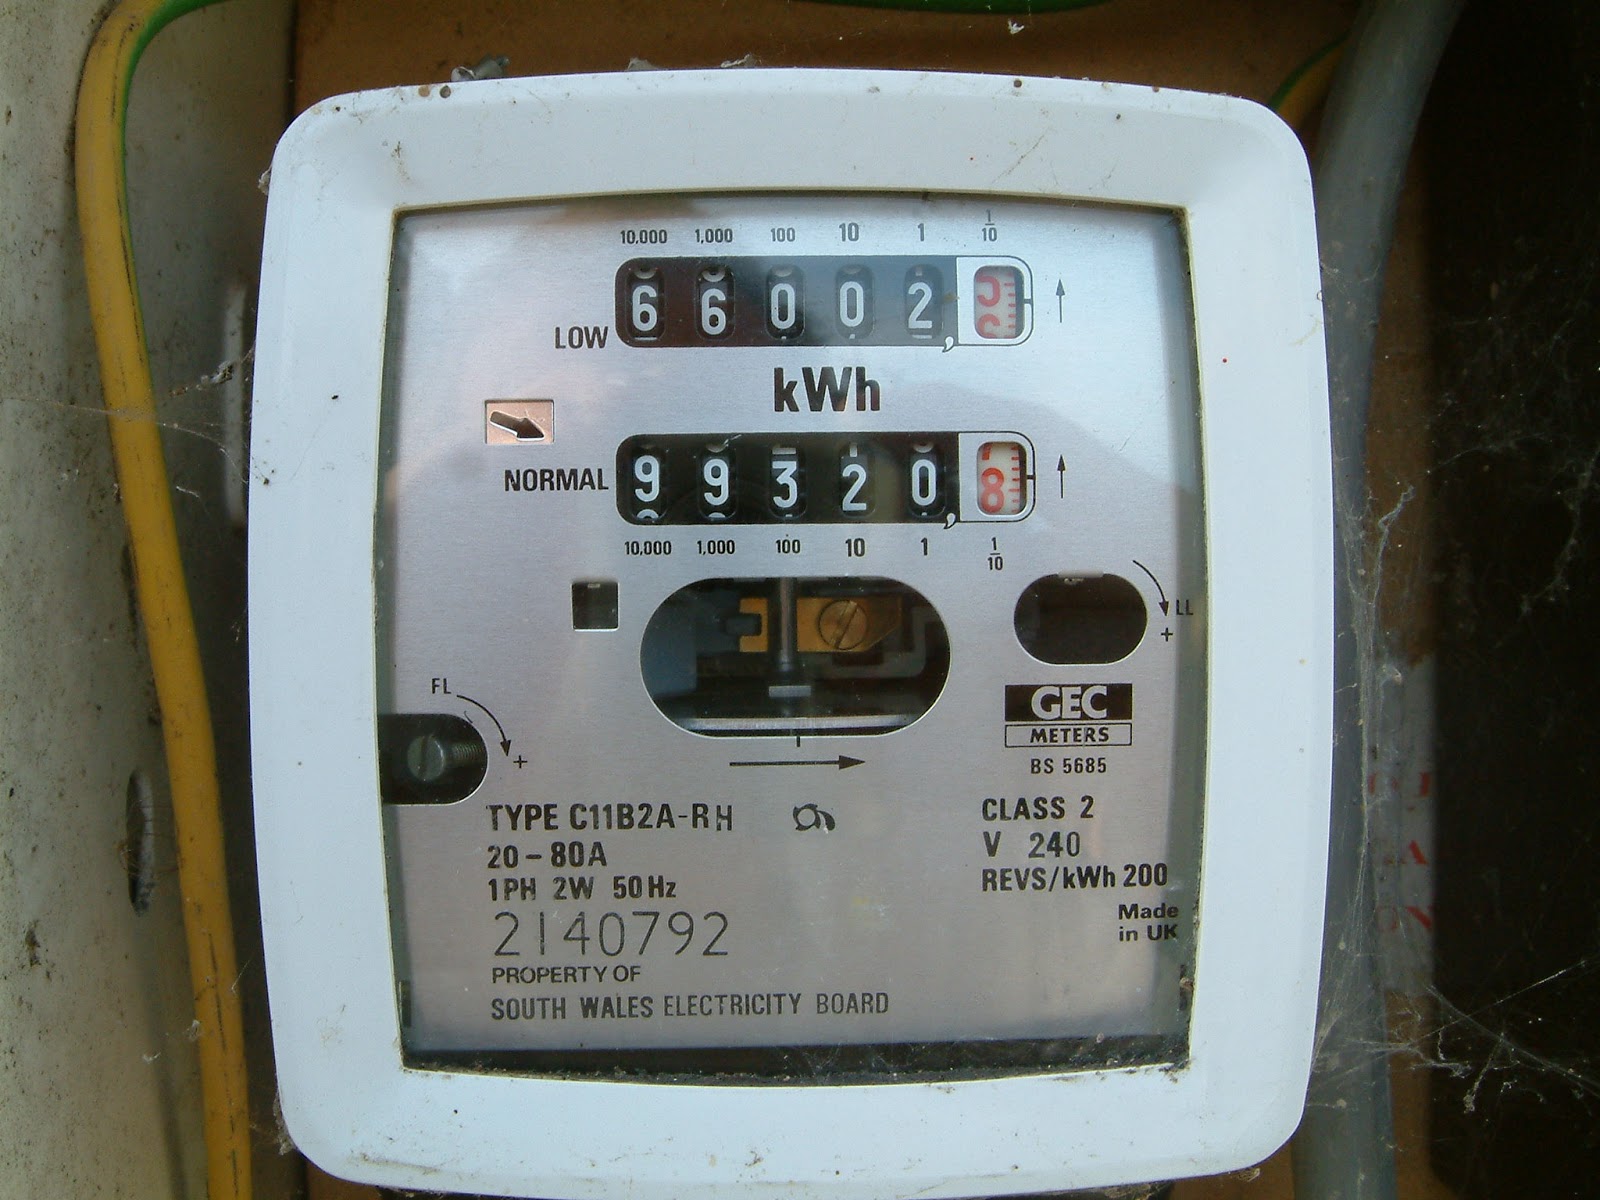
Purchased from the grid, day after day, week after week, 10 kWh per day amounts to a significant expense, but supplied from your own turbine what would have been an expense becomes a saving, - a saving which can be thought of as justifying the initial cost of the turbine.

To illustrate how great the saving is, consider some real life figures below showing energy taken from the grid (kWh) in the first quarter of each year for the 10 years before I installed my turbine and for the 5 years after:

... there is an unmistakeable step-down in kWh taken after the turbine was installed, - and this represents the saving made by installing it. (Incidentally, the increase seen in 2018 resulted from acquiring a Nissan Leaf in late 2017).

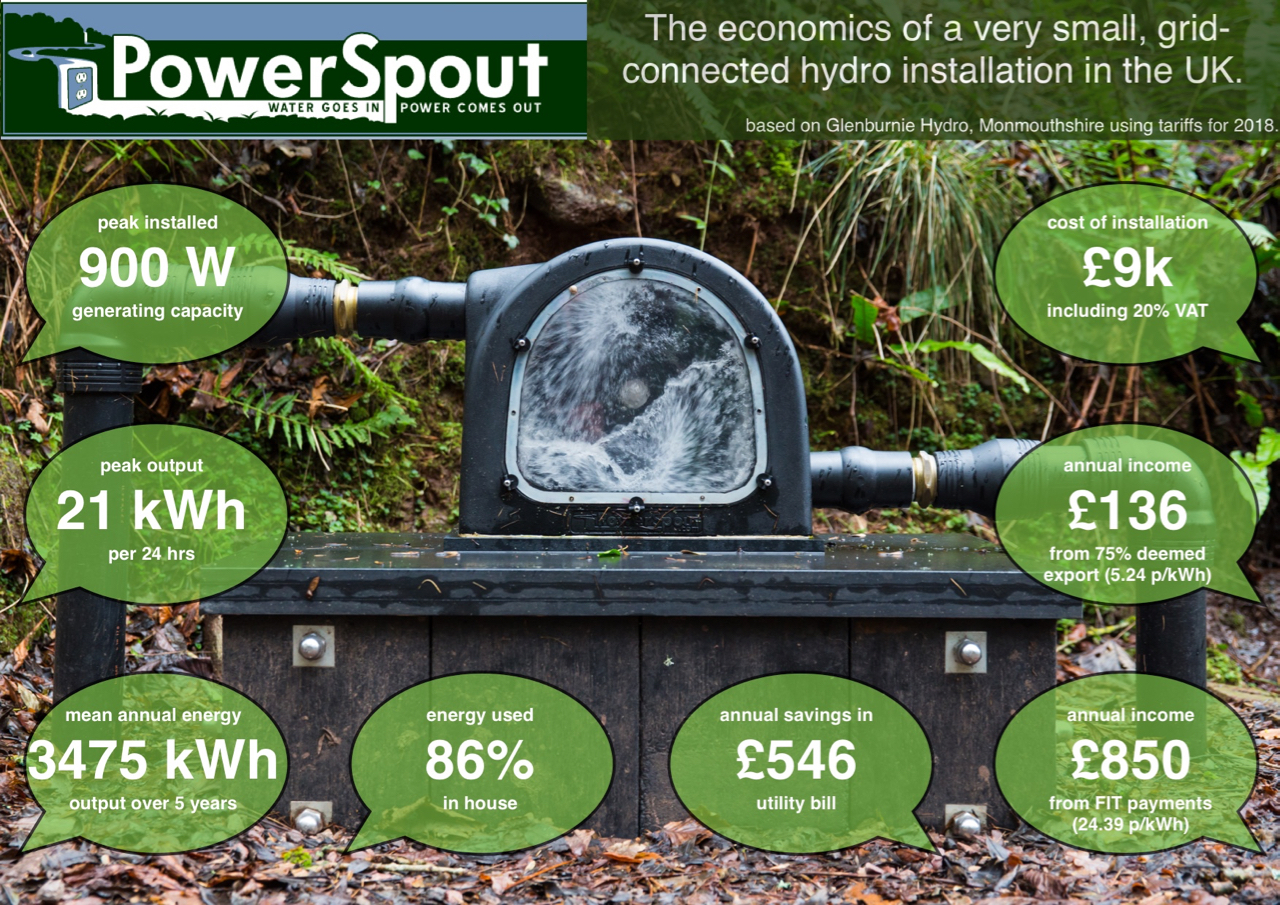
The value of the saving in this one quarter is £350.  For a whole year it is £546.

So, whilst Feed-in-Tariffs may be ending, a small hydro can still pay for itself through the savings of offset. Certainly, without FiT's payments the time taken to recoup the cost of installation will be longer.  With FiTs payments for me it has been 5 years.  Without FiTs and keeping to 2018 electricity prices it would have been 16 years. 

So 16 years is about the period of time someone starting out in very small hydro after 31st March 2019 should be thinking of as the time it might take to recoup the installation cost.  It seems a long time, but it could be shorter, perhaps much shorter if electricity prices really go through the roof.

Saturday 24 November 2018

Usefulness

There are just two measures of how useful any renewable energy scheme is:

- how many days in a year it runs
- how much it generates when it is running

In renewables parlance, the 'days run' are spoken of as being the availability factor and how much is generated over a year when it runs as the capacity factor. 


More completely described, the capacity factor is how much energy (kWh) is generated in a year as a fraction of how much could have been generated if the installation had run at its rated capacity for the whole year.  Thus defined, it can be seen that capacity factor incorporates a scheme's availability factor since if a turbine isn't running for some days (↓ availability) necessarily the year's output will be less (↓ capacity factor).

I read recently that in the UK small wind turbines typically deliver a capacity factor of just 15%, whilst PV panels manage 17%.  These figures reflect the obvious: the wind doesn't blow all the time (↓ availability) and when it does blow it doesn't always blow sufficiently to drive a wind turbine to its full rated output (↓ capacity factor), - and for PV, the sun only shines in the day not the night (↓ availability) and even then is not always bright enough due to clouds or inclination in the sky to give maximal output from the rated capacity of the array (↓ capacity).

Comparing these figures with those of my turbine over the past year sheds a rosy glow on how useful the turbine has been: having run for 365 days its availability factor was 100% and the capacity factor 58%. (see plot below)

Figures as good as these are unusual for a very small hydro and it's worth touching on some of the reasons:

  • the source is a spring whose flow comes from groundwater; a spring depends in a loose way on rainfall and is more constant in its output than a source using a watercourse, where the flow will closely reflect whether it has rained or not
  • my abstraction licence doesn't specify a 'hands off flow' - meaning I'm free to take all the flow available, even in the dry times of a year
  • by having an orderly range of nozzles of different sizes and maintaining a regime of changing between them to suit what flow is available, nearly maximal use of flow is achieved 
  • by using washers to make the rotor stand off from the stator with the aim of keeping the speed of the turbine up at low flow times, output is always maximal for the flow available
  • by swapping from a 42 pole stator to an 18 pole in the dry months, the turbine can be kept in operation at low flows; also its speed can be kept up by using an 18 pole stator beyond what is achievable by packing off the rotor with washers; the issue is caused by too strong magnetic attraction, for the torque available at low flows, between the rotor and the iron cores of the many poles when a 42 pole stator is in place 
  • by using a Type 2+ (high power rotor) at high flow times, turbine speed is kept down when otherwise it would go too fast for optimal output
  • a full range of spares kept on-site means days are not lost to generation by waiting for spares to arrive
  • a plan of preventive maintenance and a sturdy initial installation has so far eliminated prolonged down-time from unexpected problems


Capacity factor = (3816 * 100) / (0.75 * 24 * 365) = 58%

Availability factor = 100% (turbine ran 365 days: the one day showing no output is Feb 29th, included for spreadsheet reasons, but 2018 was not a Leap Year: hence no output shown that day).

Saturday 3 November 2018

Very small hydro in 2018 - the economics.

Later this month I've been asked to give a talk on installing and operating a very small hydro.  Much of what I intend to say in 20 minutes is summed up in this picture, - as the saying goes: a picture's worth a thousand words !


Monday 1 October 2018

End of year results: 2018

The end of September marks the end of the 12 month interval I use to report annual generation. September and October are the driest months of the year and for neatness of display in a graph, it is convenient to have a "water year" begin and end when output is at its lowest.

Close scrutiny of the three graphs below reveals all that is important for learning how productive my installation has been.  All three graphs are derived from the same raw data and that data is a record of the number of kilo-watt-hours (kWh) generated each day.  This data is captured automatically by the SMA inverter, transmitted wirelessly to an SMA Sunny Beam and downloaded each month from the Sunny Beam to my computer.

In each graph, the bold black line represents the results for the 2017-18 "water year" which has just ended.  Previous years are shown for comparison.


Comments:

  • With a total of 3816 kWh generated, it has been the second most productive year so far.
  • The year started slowly with less energy generated than previous years up to the end of December
  • From December onwards output then exceeded previous years through until mid-May
  • From mid-May onwards, output fell to being less than most previous years
  • The good output between December and mid-May was achieved through peak generation hitting just in excess of 900 W whilst in previous years it had not exceeded 800 W
  • This higher level of generation was made possible within the limits imposed by my abstraction licence by knowing with greater refinement the volume of water the turbine was actually taking and operating it to within the upper margin of error intrinsic to the way the volume imposed by the licence is calculated. 
  • The volume of water extracted for the year totalled 45,791 m3.  My licence limit is 49,982 m3.
  • Capacity factor for the year was 58% (using as datum the design power of 750 W; calc: 3816*100 / [0.75*24*365] )
  • Availability factor was 100% (non-availability of the turbine for generation, whatever the reason, never exceeded 4 hours in any day; I only count whole days as being an impairment on the availability factor).


Monday 27 August 2018

Blast through time

It's that time of year when once yearly maintenance jobs need to be done, and de-silting is one of them.  This year I devised a new way of blasting through the penstock without having to take the turbine off its plinth:


A galvanised union, barrel nipple, 90 degree elbow, and a short length of threaded pipe, each in 2" size, were all that were needed. The union screws on to where the jet sleeve has a thread for the nozzle retaining cap.

With the head tank de-silted and the penstock as clean as a whistle, I'm ready now for the best possible level of generation in the coming 12 months.

Sunday 12 August 2018

Policing water abstraction

Yesterday the abstraction police descended on me: Saturday morning, unannounced, in an unmarked vehicle and brandishing paper copies of my abstraction licence.  The intent was clear: to catch a criminal in the act of transgressing the terms of his licence.  Is it just me who gets irritated by such tactics ?

I was irritated from the start, and that was a shame because the Natural Resources Wales (NRW) policeman who came to make the inspection was a decent fella, with a wife and child, worried about the security of his job with NRW, and with an interesting career before joining NRW. But we got off on the wrong foot with each other, largely because the circumstances of the unheralded visit made me resent being treated as a neo-criminal. Not just that: there's a long standing sore dating from when I first applied for my abstraction licence which has yet to heal.  I still feel hard done by and am left nursing a grievance that NRW as an organisation fail to properly engage with clients. 

With the decent fella however, toward the end of his visit, bridges had been built.

This is the third inspection I've had and each time it's someone different.  No continuity which might make for a fruitful discussion with someone who knows the site from a previous time.  So he was seeing it afresh.  Everything needed to be explained. Queried. Photographed.

There really ought to be another way, a better way, of doing this sort of compliance visit.  Most of us who have small hydro sites are people who are environmental enthusiasts.  We're not going to be trashing the water courses of Wales or draining them dry from over-abstraction. And in any case, the damage possible from such minnow schemes as mine hardly makes it justifiable to do a compliance visit every year.

NRW have more important things they should be addressing: they still haven't managed to sort out a reporting system for hydro abstractors to give their annual readings on-line.  It's been banded about for over three years, launched and failed twice and still hasn't seen the light of day. 

It's a question of priorities: their finances are tight so they need to deploy wisely what little they have.  Not happening at the moment though !

Sunday 15 July 2018

The latest picture

It's proving to be a hot summer.  No rain for over a month and I'm down to my next to smallest size of jet. But unlike many small hydros at least mine is still generating.  The number of kWh it manages in a 24 hour period is not many (3 in fact), - but solar panels make the generation total 17 - 24 kWh / day.

Here's what things look like as of today:

At the top end:


At the business end:


At the consumption end:


At these low flows, the usual 42 pole stator is replaced by a reduced stator having only 18 poles.  Without this there is too much magnetic attraction between the permanent magnets of the rotor and the steel core of the poles for the pelton to get up to speed.  Here is what the reduced core stator looks like:


Friday 8 June 2018

The picture now ...

It's June and water flow is drying up.  For comparison with the pics posted in March, these pics show how the set up is running this morning:

1. View at the top end


2. View at the business end


3. View at the consumption end

Friday 6 April 2018

Pictured yesterday...

Yesterday was a perfect cloudless day, - giving near maximum photo-voltaic output (19.54 kWh) on top of maximum hydro output (20.92 kWh) : total 40.47 kWh.  This concurrence of maximum outputs only happens at this time of year when water flow is still good and the sun sufficiently high in the sky to make the pv panels give close to their full rated output.  It also helps that the air is still cool, which boosts the output from the pv panels.  

For those discerning enough to note it, the asymmetrical shape of the solar output curve is because the orientation of the panels is ESE, - and they are located in the northern hemisphere.
😊


Saturday 10 March 2018

Pictured today...

1. View at the top end
2. View (and sound) at the business end


3. View at the consumption end

Sunday 4 March 2018

Optimum speed

It's been cold here with temperatures well below freezing. It's a good job that flowing water takes a lot of cold to stop it flowing:


But cold is not what I want to write about in this Diary entry, - rather it is the matter of optimum speed.  
A pelton wheel best converts energy from the force of the jets hitting its cups to rotational energy when it is turning at a particular speed.  That speed will be quite specific to the pelton wheel itself, - size being a major determinant, but also specific to the site at which it is working, - where the net (dynamic) head is a major determinant.

The relationship between rotational speed and power output is commonly presented in text-books in the form of this graph:
 ...which I used in a Diary entry a year ago (see here) to illustrate how changing the speed (by packing off the rotor) had an effect on power output.  As can be gathered from the graph, power as a proportion of maximum power is greatest when speed as a proportion of optimum speed is 1, - i.e. maximum power when speed is at optimum speed.

The difficulty this graph creates for people like me, who want to run their Powerspout so it produces as many kWh's as possible, is the question of what the optimum speed for their particular site is.

To try to answer this question, I have for the past year been measuring speed and efficiency at each and every flow condition at which the turbine has operated.  To date, I have accumulated 29 pairs of speed/efficiency figures, which is enough data to plot a reasonably presentable graph:


Now plotting efficiency against speed is not, of course, the same as plotting [power / optimum power] against speed. Moreover, the efficiency I have used is 'whole system efficiency' rather than 'turbine wheel efficiency', - and 'whole system efficiency' has a lot of variables external to the pelton wheel itself which might corrupt a relationship with speed.

So it is unsurprising that my plot doesn't look exactly like the text-book graph, - it is much 'flatter' in its 'peak'. But I would suggest, nevertheless, that efficiency is a reasonable surrogate for [power/optimum power].  After all, efficiency ought to be highest when speed is at its optimum.

When the graph was first displayed in my computer's spreadsheet, I have to admit to being rather pleased at seeing that its flattish top seems to lie at a shaft speed of around 1050 rpm.

A year ago when I wrote about knowing what my optimum speed might be, I guessed it was between 950 and 1000 rpm.  This latest investigation nudges that guess to a slightly faster speed, - and perhaps gives the new figure an aura of greater respectability by having been arrived at by 'research'.

Having been snowed-in where I live for the past 5 days and with the roads not looking like being clear yet awhile, bringing together this data has, at least, given me something with which to be occupied. Keeping away 'cabin fever' is terribly important !

Saturday 17 February 2018

Meter deviousness

The 'big six' electricity companies in the UK understandably get concerned when they see from their records that a customer's bills have suddenly become smaller.  If they see that decrease in their income to have coincided with the installation of a 'micro-renewables' at the customer's premises, the conclusion they come to is: the supply meter must be being made to run backwards when energy is exported to the grid.

Such has been the accusation levelled at me in this past week by SSE (Scottish and Southern Electricity).

It is completely reasonable that SSE should want to investigate when they think such a situation has arisen, but the somewhat irritating thing is the way they go about it.  Instead of writing to say what their suspicions are, they say this: "we have come to know that your meter is incompatible with the  micro-renewables system that you have had installed. On a regular basis we extract data from flows that are sent between ourselves and your local network operator. It was highlighted on this report in January that we have come to the knowledge that the meter at your property is incompatible".

Part of the reason why they write such utter nonsense is because the government in the UK has set a target of having 'Smart meters' installed in all domestic premises by the year 2020.  The onus for meeting this target is upon the "big six" electricity companies. So given a situation where they think a meter is running backwards, rather than saying so they just say "your meter needs to be replaced".

From a consumer's point of view however, having an old-style meter replaced by a Smart meter carries implications, - possibly quite major financial implications affecting the income he gets from his "micro-renewables" installation.  This comes about because a Smart meter will measure precisely how much energy is exported, so instead of export payments being based on "deeming", they will come to be based on a metered reading.  For a Powerspout owner where deeming is reckoned at 75% of generated kWh's, this will mean a severe reduction (read here for more about why).  And for people who have any of the devices (such as an Immersun or a SolarCache) that divert surplus energy to alternative loads within the home, - again Smart metering will be a hit on the income they receive from that part of the Feed-in-Tariff which comes from the export payment.

Now SSE is, in my opinion, a good company.  I have held them in high regard ever since they helped with the installation of a 300 kW hydro at a small hospital in Uganda where I used to work (see here).  So when I took up my pen to object to having my meter replaced, and to object to the manifestly fabricated evidence they put forward for replacing it, I did so with a feeling of respect.

The incontrovertible weapon I have for resisting is that my meter does NOT run backwards. So if that argument is their sole reason for insisting on replacement, - their case fails.  If, on the other hand, they were just using that as a Trojan Horse argument in order to get one more old-style meter replaced by a Smart meter to help meet the 2020 target, then they will have to think again.  Although the supply meter at my house is the property of SSE, any change to the installation needs to be made with the agreement of the customer, - and from me that is not likely to be forthcoming.

Post script added 21 Feb 2018: an interesting, if trifling, point of detail came to light after writing the above entry when SSE sent another email explaining why they were so insistent about my meter being able to go backwards. They had the wrong entry in their records for the type of meter I had. They had it recorded as Type C11B2A-R, - which is to say lacking the "H" at the end (see photo below). Apparently the 'H' is all important: lacking it means the meter can go backwards; having it means it can't. So now we know !


Saturday 27 January 2018

Comparative efficiencies

In this diary, I seem to go on rather a lot about efficiency.  For some the subject may hold little interest, but for me knowing the efficiency at which my Powerspout is operating and trying to improve it, are matters which engage me.

To recap as to what efficiency is in relation to a water turbine, - it's a measure of how good the installation is in translating, into useful electricity, the energy which is available from the fall and flow at a site.  But a consideration of efficiency need not apply only to generators which use hydro power.  It can be applied to generators using any of the energy sources commonly used: coal, gas, nuclear, solar etc.

Recently, in searching for information about how efficient other people's hydro sites are, I have come across the web site of the US Energy Information Administration. It's quite informative. The site can be found at this web link and there is much of interest answering the question: "What is the efficiency of different types of power plant?"

Summarised below is the data the link provides, - the efficiencies are given for the different types of power station in the US, in the year 2016, averaged across the efficiency of all power stations using each form of energy. The point to be noted is that these figures are real figures, derived from actually measuring the efficiency of each and every power plant in the US. It's an exercise done every year and the data presented includes how the figures change year-on-year for the last 10 years. That too is interesting because it shows how efficiencies in each category are tweaked to be better as technology improves over time.
Whilst noting that the efficiency for 'conventional hydroelectric'is 90% (conventional meaning that pumped storage hydro is excluded), it should be made clear that the power plants included in the survey are all large scale installations generating MW's of power, - like the Hoover dam which can put out 1,345,000 kW.  It is the size of such power stations which makes possible efficiency benefits at every stage of the energy transformation process, so that an overall efficiency of 90% becomes possible. The same would never be possible for a Powerspout turbine generating barely 1 kW. Small size is inherently less efficient.

So my 'best' efficiency of 55% comes a long way below the Hoover dam efficiency ! But what I would really like to know is the efficiency seen by other operators of really small sized turbines. How does my 55% compare with them. The web seems to be silent on the matter. Anyone with any reliable info in this area please comment.