
There is an old saying which goes: "If you ask a man with a watch what the time is, he will tell you; but if you ask a man with two watches, he can't". Something of the truth in this applies to my ability to reveal the answer; having two ways of measuring the energy total inevitably gives two different figures.
Below is a plot of the cumulative energy output of my turbine for the three water years it has been running; the data is captured automatically from the inverter; as can be seen it gives a total of 4,032 kWh:
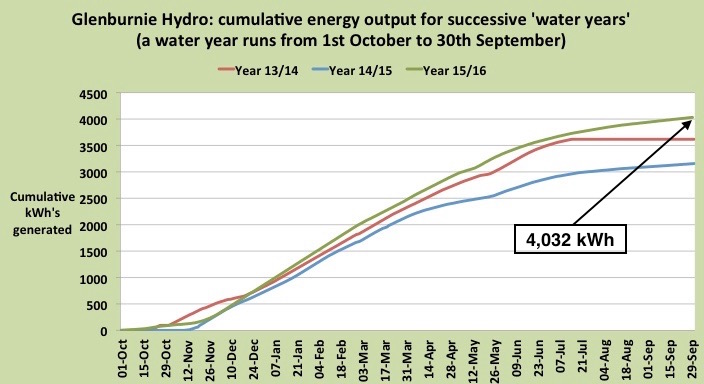
But an inverter is not designed for the very accurate capture of data; there is an Elster energy meter also in the circuit which is more accurate, - as it must be for determining FIT payments on energy generated; and the total it gave was 4,168 kWh.
So, as the graph shows pictorially, even with its less than accurate total, the year just finished has exceeded both previous years. A consequence will be that I'll probably exceed the amount of water I'm licensed to abstract in a twelve month period (it is calculated from the figure for energy generated); but since the accounting period for that twelve months is April 1st to March 31st, the matter will not arise until 2017.
Another way of presenting the data in the above graph is shown below. Here, instead of plotting the cumulative total reached at each date, what is shown is the actual energy generated each day; this relationship gives an idea, not seen in the above graph, of the variation as the year's seasons come and go:

From this plot it will be seen that peak generation in 2015-16 (18.9 kWh/day) was higher than in the previous two years and also that generation continued throughout the water year, the first time this has been possible. Both of these improvements resulted from gaining a better grasp of the science behind a Powerspout, the first by squeezing from the system a small improvement in efficiency and the second from using, in the drier months, a modified stator in the alternator.
The third and final way of looking at productivity is rather different from the above graphs but it uses exactly the same raw data. People familiar with hydros are usually familiar with flow duration curves (FDC's), that type of curve called an exceedance curve which depicts what percent of a period of time, usually a year, a given flow in a watercourse is recorded as being present.
These days, rather than measured flow data being used to construct an FDC, rainfall data and catchment area are used to compute the flow; computer calculated FDC's can be purchased for any watercourse in the UK, at a price, without the tedium of taking any actual measurements of flow; their accuracy is questionable, especially for the small streams a Powerspout might be installed on; yet the authorities responsible for licensing water abstraction in each of the national regions of the UK often insist on applicants providing them.
A curve called a power duration curve can be constructed in the same way as for an FDC but using power data rather than flow data. Here is such a plot for the output of my turbine over the past three water years:

Such a plot is rather useful. Whilst it has all the same features evident in the two plots above, it shows in addition something not evident in those plots; it shows a characterisation of the annual flow in the watercourse, just as if it was a flow duration curve.
For a site like mine where no 'hands off flow' is required, a provision which allows me to take as much flow as I can up to the design flow of the turbine, the shape of the power distribution curve will be almost identical to the flow distribution curve, at least in that part of the curve below the maximum power level. It will only be 'almost identical' for two reasons: because the system efficiency is reduced at very high and very low flows, thus making the relationship between output power and flow to be non-linear; and second because I don't always manage to take all the flow. But notwithstanding this limitation, it will be a far more accurate characterisation of stream flow than any FDC could possibly give, based as it is on daily electrical readings which are so much more precisely captured than water flow readings.
The usefulness of plotting a power duration curve each year will come over time. If, as we are led to believe, Wales is going to get wetter as climate change happens, successive year plots layered over previous years should show clearly whether greater wetness is indeed happening. It'll be a very, very, local investigation into the effects, if any, of global warming !
For anybody interested in learning how to construct exceedance curves, I found this pdf document on Phil Maher's Hydromatch site to be much the most helpful.
No comments:
Post a Comment